Investment Team Handelsbanken Wealth
01 Sep 2026 8
This website and all the information provided on it is intended for users domiciled in the UK only. By continuing you are confirming that you have read the important information and understood the legal information contained within. You are also consenting to the use of cookies on this site.
The reason that some expressions pass into investment cliché is because they’re true. This old adage is as true today as it’s always been.
First principles
In simple terms, there are two ways to invest in the stock market. One is to actively trade by seeking the perfect entry and exit points. This is labelled as ‘timing the market’, an approach reliant on ‘buying low’ and ‘selling high’.
The alternative is to be a ‘time in the market’ investor. Such investors capture the underlying fundamentals that drive stock markets. They also understand that consistent compounding over the longer term is a far more powerful tool than attempting to make a never-ending series of successful trades.
Tenure not timing
Part of the problem with ‘timing the market’ is that it’s based on a fallacy. It assumes that an investor can predict a stock market correction before it happens, and sell out accordingly. It also assumes they can spot when shares have hit their nadir and buy back in to enjoy optimal returns on the ride back up.
The fact that so few professional fund managers consistently outperform their stock market benchmarks underlines how difficult this is in practice. This is what’s driven the mass migration to ‘passive’ investment solutions (that track a market index) in recent decades.
Statistically, the odds are piled very high against the active trader, and that’s before you consider the additional trading costs and potential tax charges that attend this approach.
Missing the best days
When it comes to generating long-term investment returns, consistency beats intensity (almost) every time. Indeed, time is an investor’s greatest weapon.
The chart below neatly demonstrates this. It shows that a 25-year investment in the MSCI World Index would have returned 729.5% to a patient investor (1). It also shows the tremendous damage of missing just a few of the market’s ‘best days’ over a quarter of a century.
• Missing the 10 best days would have more than halved this return to 362.7%;
• Missing the 20 best days would have cost over 500% in lost returns;
• Missing the 30 best days would have slashed the return to just 119.2%.
It’s also worth remembering that, statistically, the ‘best days’ for stock markets tend to follow close on the heels of the worst days.
This helps to further stack the odds against timing the market. It also means that the longer you maintain your investment, the more likely it is that the compounding of your returns will outweigh the benefits of actively trading in and out.
(1) Net return from the MSCI World Index from 2 September 2001 to 11 August 2026. Source: Bloomberg.
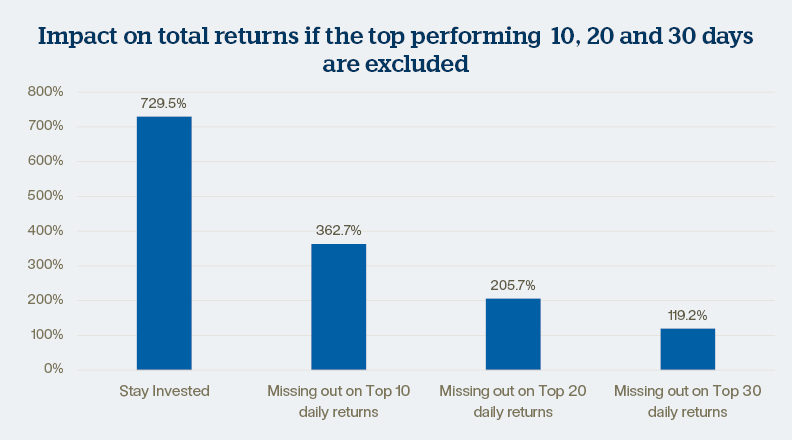
What the chart shows: 25-year net sterling return from the MSCI World Index of developed markets versus returns from the same index less the 10, 20 and 30 best trading days over the period. Data from 2 September 2001 to 11 August 2026. Source: Bloomberg.
Making the fundamentals work for you
The great strength of ‘time in the market’ is that it captures the fundamental drivers that propel stock markets, namely the compounding of global productivity and inflation.
There are four key fundamentals that are captured by owning shares:
1. Economic or GDP growth is reflected in rising company earnings;
2. Inflation is captured through rising corporate revenues and asset values;
3. The positive ‘expected return’ on shares (statistically they go up far more often than they go down);
4. The ‘equity risk premium’ – the notional additional return investors demand for taking the added risk of stock market investment.
In order to capture the equity risk premium, you just need to be invested. This underlines that the biggest risk for most small investors is sitting on the sidelines in cash.
Investing during market highs
It’s natural to fret about investing when the headlines are dominated by news of new ‘record highs’. While attempting to ‘time the market’ might mean sitting on cash in the hope of finding some more advantageous entry point, for those that understand the strength of ‘time in the market’ the best time to invest is always now.
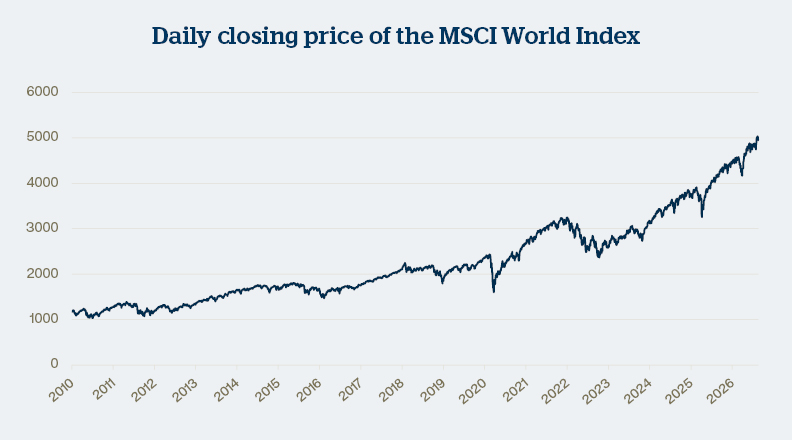
What the chart shows: Daily closing price of the MSCI World Index from 1 January 2010 to 21 August 2026. Source: Bloomberg.
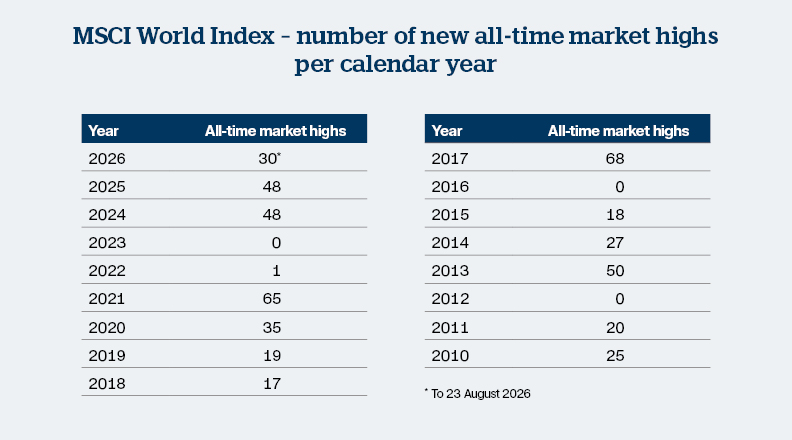
The MSCI World Index is a prime example. By late August 2026, the index had already recorded 30 record highs since the start of the year. Hence, any investor who exited at the year’s first record high would have missed each of the next 29, not to mention any subsequent highs still to come.
Keep in mind that in both 2024 and 2025, the MSCI World Index crashed through 48 new record highs while back in 2021 it passed 65 (well over one a week!). Keep in mind also that record highs are a strongly ‘bullish’ signal for markets. Consequently, they tend to encourage greater investment.
Statistically, by far the most common thing to follow a record high is another record high (although the pattern inevitably stops at some point).
Overcoming ‘loss aversion’
We feel the pain of investment losses more than twice as much as the pleasure of investment gains (2). This is because we’re ‘coded’ to assign at least twice the significance to dangers, as we are to windfalls or pleasant surprises.
This, along with other behavioural biases, such as a tendency toward herd behaviour, and traits such as confirmation bias, overconfidence, and ‘anchoring’ (the tendency to fixate on an initial data point) leave us poorly equipped to deal with the day-to-day peaks and troughs in stock markets.
The important thing to remember is that whenever a crisis has arisen, whether it was the dotcom crash in 2000, the financial crisis in 2008, Covid in 2020, or the onset of the Iran war in early 2026, in every instance stock markets eventually drew a line beneath the event and powered back past their previous highs. In doing so, they’ve continued to live up to Warren Buffet’s famous observation that, ultimately, the stock market “is a device for transferring money from the impatient to the patient.”
(2) Prospect Theory: Daniel Kahneman and Amos Tversky 1979. The phenomenon is known as ‘loss aversion’ see The Decision Lab.
The value of investments and any income from them can fall and you may get back less than you invested.
Handelsbanken Wealth is a trading name of Handelsbanken Wealth & Asset Management Limited which is authorised and regulated by the Financial Conduct Authority (FCA) in the conduct of investment and protection business and is a wholly-owned subsidiary of Handelsbanken plc. Tax advice which does not contain any investment element is not regulated by the FCA. This document has been prepared by Handelsbanken Wealth for customers/potential customers who may have an interest in its services. The provision of this information does not constitute tax, pensions or investment advice.
Tax rates and legislation are subject to change. We cannot guarantee to inform you of any such changes and Handelsbanken Wealth accepts no responsibility for any inaccuracies or errors. Any levels of taxation referred to depend on individual circumstances and the value of tax reliefs are those which apply at 19 February 2026.
The value of the pension received when taking benefits from a pension will depend on various factors including, but not limited to, contributions made, charges and fees, tax treatments, annuity rates, investment performance. Professional advice should be taken before any course of action is pursued.
This does not constitute any recommendation to buy, sell or otherwise trade in any of the investments mentioned. Handelsbanken Wealth cannot accept responsibility for the consequence of any action taken or failure to take action by a reader on the basis of the information provided. When we provide advice in relation to investment, our own investment management services will usually be recommended. When advice on pensions or other products outside an investment management relationship is required, we will recommend products chosen from a limited selection of providers that have been appointed on the basis of its judgement in their quality of service, investor protection, financial strength and, if relevant, their financial performance. As a result, any advice given by Handelsbanken Wealth in respect of retail investment products will be restricted as defined under the FCA rules.
This document has been issued by Handelsbanken Wealth.
Registered Head Office: 25 Basinghall Street, London EC2V 5HA. Registered in England No: 4132340