Investment Team Handelsbanken Wealth & Asset Management
23 Jan 2026 15
This website and all the information provided on it is intended for users domiciled in the UK only. By continuing you are confirming that you have read the important information and understood the legal information contained within. You are also consenting to the use of cookies on this site.
Below, we outline some of our key views on the factors set to drive financial markets over the coming months, and what this means for our investment strategies.
The art of the deal…
So far this year, Mr Trump, and his Truth Social account, have been busy reacquainting the world with the original meaning of ‘US exceptionalism’. In just a few weeks, he’s rained missiles on Venezuela, abducted its leader, and its oil industry. He’s had the Justice Department subpoena Jay Powell, the chair of the Federal Reserve (Fed), and threatened Britain, and seven other European allies, with fresh trade tariffs should they fail to rubber-stamp his proposed purchase of Greenland.
With mid-term elections in November, Mr Trump is just as busy at home. He’s demanded that US credit-card issuers cap interest rates at 10%; that US institutional investors be banned from purchasing single-family homes; that the Fed cut interest rates to 1%; that gas prices are slashed to $2 a gallon; that US weapons manufacturers build new factories and up production; that Congress boost US military spending 50% to $1.5trn in 2027; and promised $2,000 ‘stimulus checks’ to voters, somehow cut from his trade tariffs.
Although global stock markets have mostly shrugged off Mr Trump’s bombastic demonstration of US ‘hard power’, his domestic ‘policy’ has impacted US share prices. It’s also sent gold and silver prices into the stratosphere.
America’s quiet revolution
The US economy is in the midst of a broad-based, technology-led industrial revolution. The latest numbers show US GDP leapt 4.4% (annualised) in the third quarter, leaving its peers in the dust. US inflation is also making progress; it hit 2.7% in November.
Recent weeks have also seen US productivity numbers land. These are the stuff of dreams for other developed economies. After averaging annual productivity gains of around 1% in the decade to 2019, US productivity growth doubled to 2% in the next five years before jumping to 2.9% in 2024. In the third quarter of 2025, it soared to 4.9%.
The stunning productivity figures confirm that the US is undergoing a technology-led productivity revolution that pre-dates AI. Such tech-driven gains raise growth and reduce inflation. With real wages rising slower than productivity, this is a ‘Goldilocks’ scenario for the US economy, namely accelerated growth without worrisome inflation – the dreaded ‘cycle killer’. The prospect of significant gains in GDP growth, alongside contained inflation, offers tremendous potential for US company earnings and, by extension, US share prices.
Asia’s sleeping giant stirs
Japanese shares have been flying ever since new Prime Minister Sanae Takaichi, the country’s first female leader, came to power in the autumn. In mid-January, Japan's Nikkei 225 Index surged to a new record high as investors bet that Takaichi’s calls for a snap election would lead to more fiscal stimulus. Meanwhile, the yen tumbled to new lows, boosting Japanese corporate earnings and share prices.
But the promise of greater fiscal stimulus has spooked Japan’s bond markets. The yields on long-dated bonds recently hit their highest since 1999 (meaning prices were at record lows). This is because decades of government spending to combat deflation has left Japan with the highest level of debt-to-GDP in the world.
We may also see other, unintended, consequences. If Japan borrows still more to ignite its dormant economy, it’s likely to result in rising interest rates and a stronger yen. This will undermine both Japan’s export-oriented stock market and the enormous yen ‘carry trade’ where global investors borrow in a low-yielding currency (the yen) to invest in a higher-yielding one.
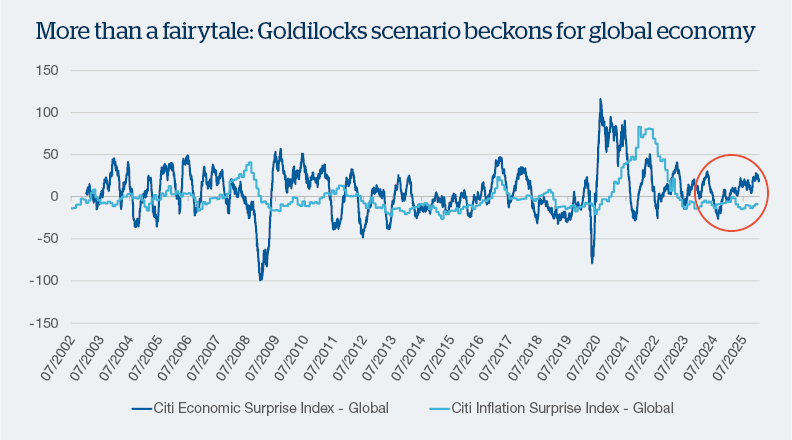
Source: Citigroup, Macrobond. Data as at 21 January 2026.
The above chart shows the progress of two ‘surprise’ indices since 2002. One is an index of economic surprises, the other an index of inflation surprises. They’re calculated by subtracting actual economic and inflation data from consensus economic and inflation estimates, which produces a directional progression of ‘surprises’.
As such, the direction of travel for each line is the important factor here.
The most important aspect of the above chart is the continuing divergence of the two lines. Namely, that for almost two years we’ve seen global economic surprises turn consistently positive, driven in no small by the US economy.
Meanwhile, inflation surprises have turned negative, reflecting that, globally, central bank actions to raise interest rates have been successful in quelling the post-lockdown return of inflation. Boosted by the impact that the war in Ukraine had on European energy prices, this led to a cost-of-living crisis on both sides of the Atlantic.
We expect both surprise indices to continue on their current trajectory thanks to a robust US economy, ongoing fiscal expansion (meaning increased government spending) in Europe, and expectations of government stimulus in China later in the year. The continued weakness of the US dollar will also help to drive emerging markets. Meanwhile, central banks have mostly brought inflation under control with only the US and UK expected to cut interest rates again 2026.
In simple terms, more ‘good news’ and less ‘bad news’ (in the form of inflation) is a ‘Goldilocks scenario’ for stock markets. Expect to see a great many references to this in 2026.
Scroll down the page to find out what our market views mean for positioning in our investment funds.

Our stock market exposure

Starting in late 2024, and continuing through 2025, we gradually trimmed our exposure to bond markets as a period of synchronised interest-rate cuts from central banks came to a close, signalling the end of a period of bumper bond market returns.
Our bond market exposure
The ‘alternative’ investment space covers an enormous universe of competing strategies and asset classes from commodities and commercial property to specialist hedge funds that employ a diverse spectrum of strategies. Consequently, broad statements as to our view on the market as a whole are redundant.
In the alternatives space we hold only gold, a select group of hedge fund strategies, and a small position in commercial property.


Our alternatives market exposure
If you’d like further information on how we divide investments in our strategies across different types of assets (i.e. our asset allocation framework, and our tactical deviations away from it), please contact us.
Handelsbanken Wealth & Asset Management Limited is authorised and regulated by the Financial Conduct Authority (FCA) in the conduct of investment and protection business, and is a wholly-owned subsidiary of Handelsbanken plc. For further information on our investment services go to wealthandasset.handelsbanken.co.uk/important-information. Tax advice which does not contain any investment element is not regulated by the FCA. Professional advice should be taken before any course of action is pursued.
All commentary and data is valid, to the best of our knowledge, at the time of publication. This document is not intended to be a definitive analysis of financial or other markets and does not constitute any recommendation to buy, sell or otherwise trade in any of the investments mentioned. The value of any investment and income from it is not guaranteed and can fall as well as rise, so your capital is at risk.
We manage our investment strategies in accordance with pre-defined risk objectives, which vary depending on the strategy’s risk profile.
Portfolios may include individual investments in structured products, foreign currencies and funds (including funds not regulated by the FCA) which may individually have a relatively high risk profile. The portfolios may specifically include hedge funds, property funds, private equity funds and other funds which may have limited liquidity. Changes in exchange rates between currencies can cause investments of income to go down or up.
This document has been issued by Handelsbanken Wealth & Asset Management Limited. For Handelsbanken Multi Asset Funds, the Authorised Corporate Director is Handelsbanken ACD Limited, which is a wholly-owned subsidiary of Handelsbanken Wealth & Asset Management, and is authorised and regulated by the Financial Conduct Authority (FCA). The Registrar and Depositary is The Bank of New York Mellon (International) Limited, which is authorised by the Prudential Regulation Authority and regulated by the FCA. The Investment Manager is Handelsbanken Wealth & Asset Management Limited, which is authorised and regulated by
the FCA.
Before investing in a Handelsbanken Multi Asset Fund you should read the Key Investor Information Document (KIID) as it contains important information regarding the fund including charges and specific risk warnings. The Prospectus, Key Investor Information Document, current prices and latest report and accounts are available from the following webpage: wealthandasset.handelsbanken.co.uk/fund-information/fund-information/, or you can request these from Handelsbanken Wealth & Asset Management Limited or Handelsbanken ACD Limited: 25 Basinghall Street, London EC2V 5HA or by telephone on 01892 701803.
Registered Head Office: 25 Basinghall Street, London EC2V 5HA. Registered in England No: 4132340