Below, we outline some of our key views on the factors set to drive financial markets over the coming months, and what this means for our investment strategies.

What's next for the global economy and financial markets?

Fragile ceasefire triggers return of animal spirits

The start of April saw stock markets embark on an historic winning streak that ran right through to early June, triggered by the White House announcing a cessation of hostilities toward Iran. Against a backdrop of halting progress towards the reopening of the Straits of Hormuz, with oil prices easing over 40% in the second quarter, and the best US earnings season since 2021, stock markets progressed in leaps and bounds.

Led by technology stocks – most notably the memory-chip makers at the centre of the AI buildout – the S&P 500 Index of US companies enjoyed nine consecutive weekly gains. Meanwhile, Korea’s Kospi Index, home to two of the world’s largest memory-chip makers, doubled in the first half of the year, as did the Philadelphia Semiconductor (SOX) Index, which tracks the 30 biggest US chipmakers. The latter has already added over $5trn in value this year, putting it well on its way to its best year this century. Despite pausing for breath in June, as AI investor sentiment soured, global stock markets progressed just over 14% in the second quarter of 2026.

Star of the show: Emerging markets

Emerging market shares were the standout in the second quarter. Although it was virtually flat in June, the MSCI Emerging Market Index surged over 23% during the quarter. This meant that in the first half of the year, the index delivered 25.5% – twice the 12.7% delivered by the MSCI AC World Index.

Technology stocks now account for over 45% of the emerging markets index, but were responsible for over 90% of index returns year-to-date due to insatiable AI demand. Asia’s three largest chip fabricators, Taiwan Semiconductor (TSMC), and Korea’s Samsung Electronics and SK Hynix, have accounted for the lion’s share of returns this year, while transforming the fortunes of their local stock markets.

While TSMC has helped Taiwan’s stock market to gains of over 60%, the two Korean memory giants, both of which are now valued at over $1trn, helped Korea’s KOSPI Index to replace the UK as the world’s eighth-largest stock market during the second quarter.

Elsewhere in Asia, unceasing AI appetite has transformed the little-known memory-chip producer, Kioxia, into Japan’s largest company, displacing Toyota in the process.

A new sheriff in town

The arrival of Kevin Warsh as the new Chairman of the Federal Reserve (Fed) in June, initially sent shivers through the US government bond (Treasury) market. The taciturn new arrival was seen as being distinctly ‘hawkish’ – meaning he favours higher interest rates to fight inflation. This triggered the biggest sell-off in short-dated Treasuries in over a year, and the strengthening of the US dollar in expectation of future rate hikes.

Mr Warsh’s intention to deliver “price stability”, is a far cry from the candidate groomed by President Trump for his rate-cutting credentials. His ambitions for an ‘institutional reset’, encompassing changes to data sources, press communications, and forward guidance, also suggest a more opaque Fed going forward. Meanwhile, the clashing views among the central bank’s 18 rate-setters, hints that Mr Warsh’s Fed could be more fractured than that of his predecessor, Jerome Powell.

While the former could potentially lead to higher interest-rate volatility, the latter augurs for a period of ‘institutional inertia’ which should keep bond prices relatively stable. While observers wait to see the changes suggested by Mr Warsh’s various task forces, markets are already pricing in more than one 0.25% US interest-rate hike in 2026.
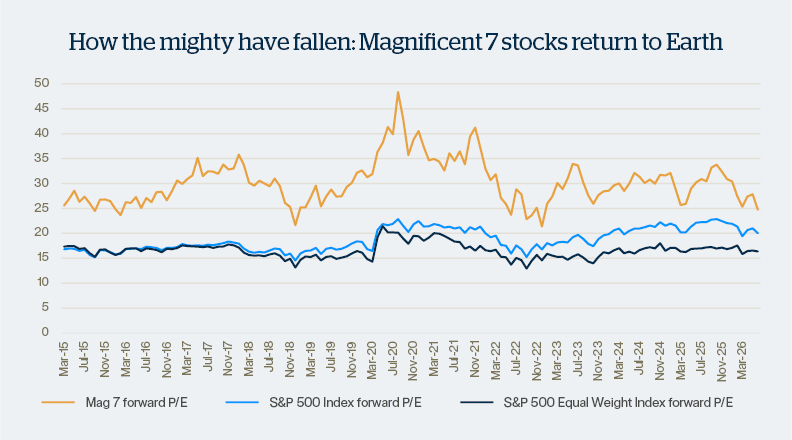
Our chart of the month

Chart Of The Month July 2026

Source: FactSet, Handelsbanken Wealth. Data as at 30 June 2026.

What this chart tells us

The above chart neatly illustrates how the price to earnings (P/E) ratio for the Magnificent 7 (Mag 7) stocks has fallen to its lowest level, relative to the S&P 500 Index of US companies, for decade. (By dividing a company’s share price by its earnings per share (EPS), a P/E ratio expresses how much investors are willing to pay for every $1 of profit generated).

In this case, our chart shows that, despite the second quarter rally in stock markets being driven by AI fervour, the Mag 7 mostly missed out on the bonanza. This was focused on shares of companies supplying essential components and equipment to support the massive buildout of AI data centres. Standout US performers in 2026 include the likes of Sandisk, a memory-card maker which has gained some 600%, and other AI names such as Dell, Intel, Micron and Western Digital, which are around 200% up.

As the Mag 7 is picking up the tab for a large part of the AI buildout, it’s shed some $2trn in market value this year, underperforming the S&P 500 Index by some margin. At the half-way stage in 2026, only Alphabet (Google), Nvidia, Apple and Amazon had seen their shares progress with Meta, Microsoft and Tesla all nursing losses.

Scroll down the page to the sections below to find out what our market views mean for positioning in our investment funds.

  • The opening week of April brought with it White House rhetoric suggesting a cessation of hostilities toward Iran. This triggered a relief rally for stock markets with the S&P 500 Index of US companies enjoying its best day of 2026 so far. This was the beginning of a significant turn in market direction that saw global stock markets power ahead throughout April and May.
  • With the US and Iran trudging toward compromise, the price of oil fell more than 40% over the second quarter from a peak of $126 to around $73 a barrel by the end of June.
  • This eased inflationary worries and allowed the dollar to weaken. Meanwhile, a massive tidal wave of earnings growth that was centred on US and Asian technology stocks ignited markets in both the US and Asia.
  • Although UK shares briefly outperformed when investor sentiment cooled – thanks to over 20% of the FTSE 100 Index consisting of oil and gas, metals and mining stocks – they underperformed other developed markets in the second quarter, gaining just 3.4%.
  • As the AI buildout theme re-emerged as the most prominent driver of stock markets in the second quarter, emerging market shares leapt over 23% while North American shares gained just over 14% on the back of the best US earnings season for five years. Japanese and European shares were close behind with double-digit gains.
  • Among our thematic holdings, a wave of recent M&A and IPO deals in the biotech space, has seen it outperform the wider stock market, repaying our conviction in the sector. Meanwhile, decreasing regulatory hurdles and a change of leadership at the Food and Drug Administration (FDA) have paved the way for more deals to come.
  • The performance of our insurance holding has recently improved. Although investors continue to overlook this area, we see the potential for strong growth as fears of interest-rate hikes have receded while US insurance premiums continue to rise due to climate change, the spread of electric vehicles, and cyberattacks.
  • Elsewhere, our position in mining companies stands to benefit from the supply squeeze on all types of industrial metals that’s being created by steeply rising government spending on infrastructure and defence, the sprawling AI buildout, and the green energy transition.
  • We remain broadly overweight to stock markets as despite the background noise, the recent rally in share prices has been driven by sensational earnings growth, not hype – especially for companies in the AI sphere.
  • We expect to see the new US earnings season continuing the recent narrative of both sustained earnings growth, and a widening of this growth to US companies outside of the AI complex.
  • We continue to prefer shares outside of the US due to the greater growth potential they present. As this year’s ‘oil shock’ continues to dissipate, European and Japanese shares will be among the biggest beneficiaries. The same argument supports our tilt towards UK and UK smaller company holdings. Meanwhile, investing in emerging markets has become more of a bet on AI stocks than investing in the US.
  • Even so, the evidence that the US economy is enjoying a cyclical upswing in growth alongside the operational excellence of many US companies means we’re reluctant to go further underweight to US shares.
  • Thanks to our overweight towards more cyclical regions – ie those more driven by the economic backdrop – our portfolios are also marginally overweight to ‘value’ investing and to smaller companies, relative to our long-term averages.
  • We look forward to the second half of the year which promises to see markets moving past the short-lived Iran war. We expect the focus to move to the reduced fears of inflation and interest-rate increases, and the strong fundamental backdrop of an expanding US economy which, along with massive AI investment, is driving sustained earnings growth.
  • Even so, this is no time for complacency. Given the stellar run stock markets have enjoyed since their nadir in March, we expect to see increasing market squalls ahead as investors choose to bank their profits.

Our stock market exposure

  • As at 29 June 2026, the Handelsbanken Wealth Balanced Multi Asset Fund, which sits at the mid-point of our portfolio range in terms of the balance between risk and reward, held 67.8% of its portfolio in company shares – a small overweight compared to our long-term average weighting.
  • Within this, we remain underweight to US stocks versus our long-term average, although the US remains our largest regional weighting. It accounts for 50% of our total stock market exposure. Conversely, we’re overweight to the stock markets of more economically sensitively regions, chiefly the UK and emerging markets.
  • We are underweight in Japanese companies, as we see more compelling opportunities elsewhere.
  • The Balanced Multi Asset Portfolio has thematic exposures to UK and US smaller companies, biotech, sustainable infrastructure, metals and mining, and insurance sector stocks.

  • The second quarter of 2026 was a volatile one for government bonds. UK government bonds (gilts) initially suffered a far worse decline than US Treasuries due to the UK’s greater exposure to the rising oil and energy prices triggered by the Iran war. They consequently rallied back harder, despite the UK’s latest political turmoil.
  • While gilts delivered 2.1% over the second quarter of the year, this was only sufficient to restore their previous losses meaning that UK government bonds were entirely flat in the first half of the year. Meanwhile, more modest returns from US government bonds (Treasuries) over the second quarter left them ahead by just 0.5% in 2026.
  • In May, global bond markets recoiled at sharply rising oil prices and signs that the closure of the Strait of Hormuz was pushing US inflation higher. Yields on 30-year Treasuries, hit 5% – their highest since 2007 (meaning their prices were at record lows). Meanwhile, 30-year gilt yields hit their highest since 1998 due to the additional political turmoil caused by ‘Starmergeddon’ and the need for yet another UK prime minister, our seventh of the decade. It was only when Labour’s leader in waiting, Andy Burnham, while still unelected to parliament, pledged to stick to the UK’s fiscal rules that the yields on 10-year gilts retreated from their highs of over 5%, meaning their prices gained, as traders walked back expectations of greater government borrowing and higher interest rates.
  • Kevin Warsh’s arrival as the new Chairman of the Fed in June initially triggered US Treasuries to sell off over fears of higher US interest rates. Whether Mr Warsh’s apparently hardline was an attempt to build credibility, and support his earlier claims of not being Mr Trump’s “sock puppet” remains to be seen. What is clear is that while the Bank of England is seeking to deliver greater transparency the Fed is making concerted efforts to do the opposite.
  • We are of the view that current projections for central bank interest-rate hikes look overdone. Indeed, while both the US and UK central banks need to maintain strong, anti-inflation rhetoric, a number of factors suggest that a pivot to cutting interest rates could be closer than most observers currently think.
  • To us, the prospect of the 2026 UK rate hikes currently priced in seem especially at odds with the underlying fundamentals of Britains’s anaemic economy, and this is what underpins our decision to move back from neutral to an overweight position in gilts.
  • With no other appreciable changes to our views, this left our total bond exposure at neutral. Within this, we were overweight to both UK government and investment-grade corporate bonds (issued by companies), relative to our long-term average, underweight to high-yield bonds and neutral on emerging market bonds.

Our bond market exposure

  • As at 29 June 2026, the Handelsbanken Wealth Balanced Multi Asset Fund held 22.6% of its portfolio in bonds, a small underweight relative to our long-term average weighting. Within this, 7.6% was in government bonds, which was a slight underweight, despite our marginal overweight to UK government bonds.
  • The fund also held 8.9% in higher-quality, investment-grade corporate bonds (issued by companies) with a 3% weighting to higher-yielding bonds of lower credit quality. This represented a slight underweight compared to our long-term average weighting.
  • The fund’s small position in emerging market bonds was in line with our long-term average weighting.

The ‘alternative’ investment space covers an enormous universe of competing strategies and asset classes from gold, commodities and commercial property to specialist hedge funds that employ a diverse spectrum of strategies. Consequently, broad statements as to our view on the market as a whole are redundant.

In the alternatives space we hold only gold, a select group of hedge fund strategies, and a small position in commercial property.

Although we’re broadly underweight to alternatives, relative to our long-term average weighting, we have significant positions in gold, hedge funds, and a small but growing exposure to property assets where we’ve recently been reducing our underweight.


  • We previously held gold as a reliable means to ‘hedge’ geopolitical risks. Although it enjoyed its strongest run up in decades in 2025, and moved higher early in 2026 due to geopolitical risks, the outbreak of the Iran war marked the end of its diversification benefits. Somewhat counter-intuitively gold sold off sharply when the latest war in the Middle East broke out as investors chose to take their profits.
  • Thanks to its previous run-up, gold is currently more correlated to risk assets such as shares and bonds. Consequently, our decision to cut our exposure to gold and go underweight at the start of the second quarter proved timely. The gold price declined by over 13% during the second quarter to be 6.6% down in the first half of 2026.

  • We hold hedge funds to protect us from violent market disruptions by providing returns with a low correlation to the movement of stock and bond markets. Our trend-following hedge fund has continued to reward in 2026 thanks to this year’s increased market turbulence and the active re-balancing undertaken by the fund’s manager. It remains an attractive way for us to ‘hedge’ the risk of sudden market declines.
  • We also remain overweight, relative to our long-term average, in what are called ‘commodity trading advisor’ or CTA funds. These employ complex derivative strategies to trade across commodities, shares and currencies and tend to perform well in recessionary periods. Given the recent correlation we’ve seen between stock and bond markets, this makes such funds an attractive addition to our portfolios.

  • Currently, economic indicators suggest that our neutral to marginally underweight positioning in global real estate is the correct stance given the intense competition for capital apparent in the sector.
  • While we believe that the best way to play property is through core property holdings with additional tactical ‘satellite’ positions in more specialist real estate trusts (REITs), we think the latter look expensive. Consequently, we remain very selective.

Our alternatives market exposure

  • As at 29 June 2026, the Handelsbanken Wealth Balanced Multi Asset Fund held 9.2% of its portfolio in alternative asset classes intended to deliver diversification from its stock market and bond holdings. This was split between a 2.5% weighting to property and a 3.3% weighting to gold – both underweights relative to our long-term averages – and a slight overweight to hedge funds (3.4%).

If you’d like further information on how we divide investments in our strategies across different types of assets (i.e. our asset allocation framework, and our tactical deviations away from it), please contact us.

Important Information

Handelsbanken Wealth is a trading name of Handelsbanken Wealth & Asset Management Limited which is authorised and regulated by the Financial Conduct Authority (FCA) in the conduct of investment and protection business, and is a wholly-owned subsidiary of Handelsbanken plc. For further information on our investment services go to wealthandasset.handelsbanken.co.uk/important-information. Tax advice which does not contain any investment element is not regulated by the FCA. Professional advice should be taken before any course of action is pursued.

All commentary and data is valid, to the best of our knowledge, at the time of publication. This document is not intended to be a definitive analysis of financial or other markets and does not constitute any recommendation to buy, sell or otherwise trade in any of the investments mentioned. The value of any investment and income from it is not guaranteed and can fall as well as rise, so your capital is at risk.

We manage our investment strategies in accordance with pre-defined risk objectives, which vary depending on the strategy’s risk profile.

Portfolios may include individual investments in structured products, foreign currencies and funds (including funds not regulated by the FCA) which may individually have a relatively high risk profile. The portfolios may specifically include hedge funds, property funds, private equity funds and other funds which may have limited liquidity. Changes in exchange rates between currencies can cause investments of income to go down or up.

This document has been issued by Handelsbanken Wealth. For Handelsbanken Multi Asset Funds, the Authorised Corporate Director is Handelsbanken ACD Limited, which is a wholly-owned subsidiary of Handelsbanken Wealth, and is authorised and regulated by the Financial Conduct Authority (FCA). The Registrar and Depositary is The Bank of New York Mellon (International) Limited, which is authorised by the Prudential Regulation Authority and regulated by the FCA. The Investment Manager is Handelsbanken Wealth, which is authorised and regulated by the FCA.

Before investing in a Handelsbanken Multi Asset Fund you should read the Key Investor Information Document (KIID) as it contains important information regarding the fund including charges and specific risk warnings. The Prospectus, Key Investor Information Document, current prices and latest report and accounts are available from the following webpage: wealthandasset.handelsbanken.co.uk/fund-information/fund-information/, or you can request these from Handelsbanken Wealth or Handelsbanken ACD Limited: 25 Basinghall Street, London EC2V 5HA or by telephone on 01892 701803.

Registered Head Office: 25 Basinghall Street, London EC2V 5HA. Registered in England No: 4132340

You may also be interested in

View all articles

Investment Update

Quarterly Investment Update - June 2026

Weekly Bulletin

AI investors get cold feet

Weekly Bulletin

Salad days for chip stocks

Insight

Starships and unicorns

